Production optimization the basis for Industry 4.0
 Can show what happened if server is breakdown, the queue is limited, new server is add or removed in the line,
…
Simulation can train the machine operators how to react on nonstandard or breakdown situation
Can help with new production line proposal
Industry 4.0
Contact: mauder@fme.vutbr.cz , stetina@fme.vutbr.cz
Can show what happened if server is breakdown, the queue is limited, new server is add or removed in the line,
…
Simulation can train the machine operators how to react on nonstandard or breakdown situation
Can help with new production line proposal
Industry 4.0
Contact: mauder@fme.vutbr.cz , stetina@fme.vutbr.cz
Motivation
Industry 4.0 ("smart factory")
- Increase production effectivity
- Increase product quality
- Assistance systems to support humans decision making
- Reduce ecological footprint
- Solving urgent problems on short time
- Create a virtual factory
Queue theory
We wait in line:
- in our cars in traffic jams
- at supermarkets to check out
- at fast-food restaurants
- at banks and post offices
- to be serviced
We, as customers, do not generally like these waits
Queue theory
Why queue appears? The answer is simple:
- There is more demand for service than there is facility for service available.
Why is this so? There may be many reasons:
- there may be a shortage of available servers
- it may be infeasible economically to provide the level of service necessary to prevent waiting
- there may be a space limit
There are two main question:
- "How long must a customer wait?"
- "How many people (goods) will form in the line?“
Queueing theory attempts to answer these questions through detailed mathematical analysis.
The pioneer work was wrote by mathematician Agner Krarup Erlang in 1909
The queuing theory investigation accelerated in the 1950s
There are many applications of the theory:
- probability theory
- operations research
- management science
- industrial engineering
The term "customer" does not imply necessarily a human customer. It can be an airplane waiting in line to take off, or a computer program waiting to be run, or a component waiting to be threated, …We will call it “entity“ instead.
The term “service" mean some operation where entity must stay for some amount of time. We will call it “servers“.
Example of queueing process:
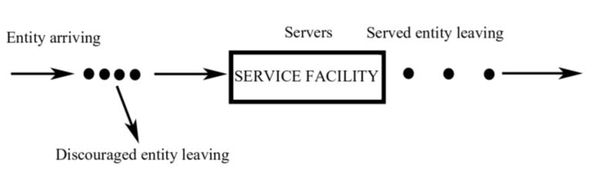
There are six basic characteristics of queueing processes:
- arrival pattern of entities (stochastic or deterministic)
- service pattern of servers (single or batch, stochastic or deterministic)
- queue discipline (FIFO, LIFO, random, higher-priority)
- system capacity (maximum length of queue)
- number of service channels (single or multichannel)
- number of service stages (single or multistage system)
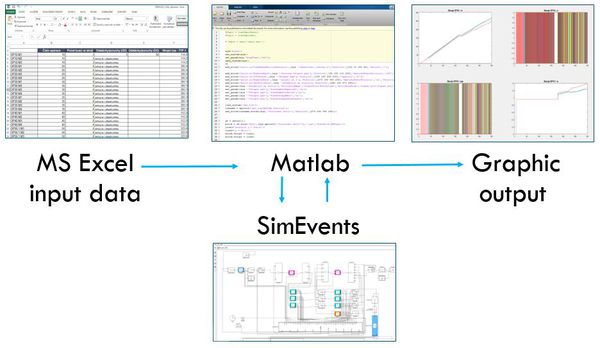
Software implementation
MATLAB – SIMULINK – SIMEVENTS
- Commercial software
- Easy implementation
- Direct link with MATLAB
INHOUSE C++ IMPLEMENTATION
- User-specified implementation
- Independent (standalone) application
Input and Output data
- MS excel *.xls, *.xlsx
- text file *.txt
- Matlab *.mat
Output graphs
- Figures in *.png, *.fig, *.tif, …
Animation
- Matlab visual studio
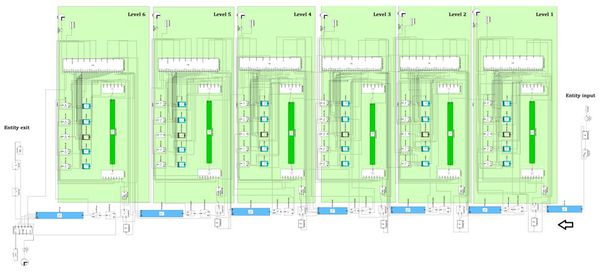
Example of simulation
- Entity is semifinished product
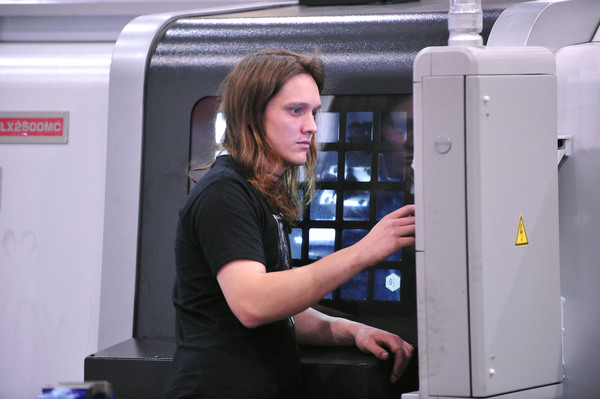
- Server is CNC lathe
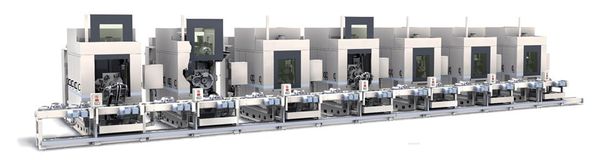
- Six stages with four paralel servers
- Seven FIFO limited queues
- Service pattern batch (4 entity at the time)
- Deterministic entity arrival
- Deterministic serviced time
- Limited numbers of entities in the process
- Run with and without service maintain
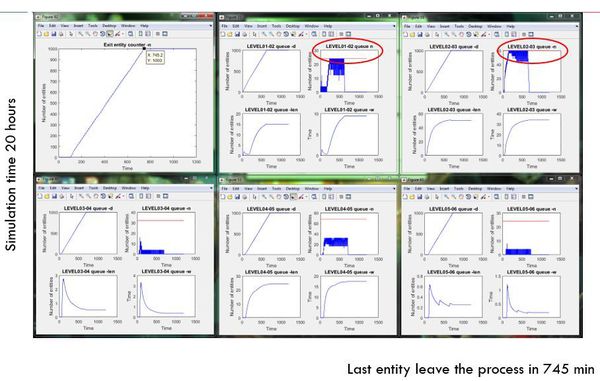
Case 1
- Total number of entities 1000
- Simulation time 20 hours
- Queue capacity [50 24 60 32 72 24 32]
- Terminals between queue and servers
- Service times [500 400 600 500 600 500 sec]
- Entity removal at the end of line [50 sec]
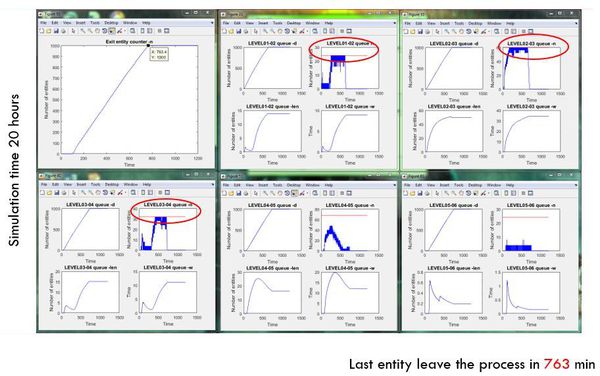
Entity removal at the end of line
- [50 sec] -----------> [20 sec]
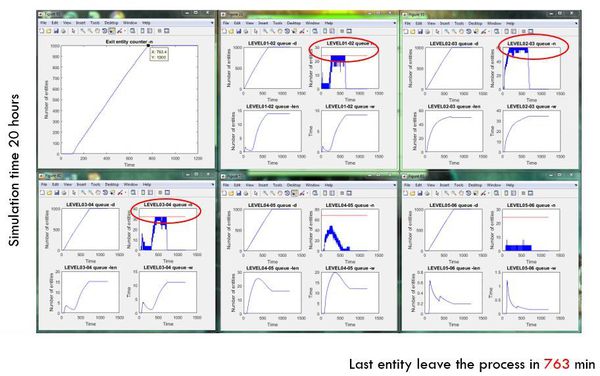
Increase service capacity or decrease service time in level 3
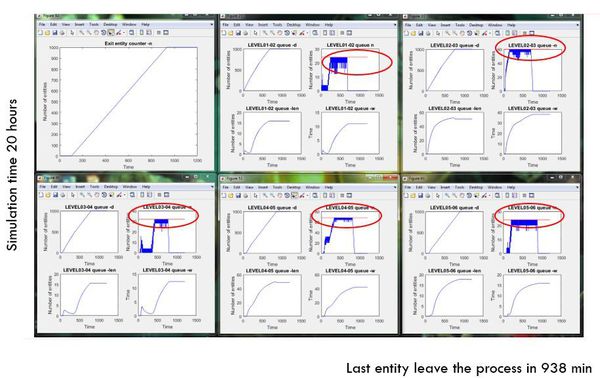
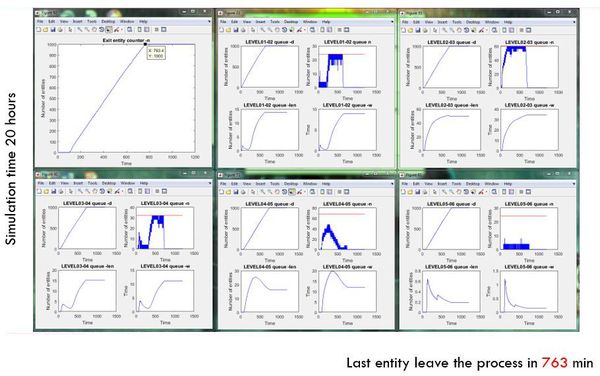
Case 2
- Total number of entities 1000
- Simulation time 20 hours
- Queue capacity [50 24 60 32 72 24 32]
- Terminals between queue and servers
- Service times [500 400 600 500 600 500 sec]
- Entity removal at the end of line [20 sec]
- Service maintain in Level 4 – one server down [time
- 5 hour – 20 hour]
Model possibility
- Every production line can be simulated with more or less simplifications
- Model can calculate with different entities in one simulation by using entity attributes
- Model can be easily extended with uncertain production data by using probability distributions
Conclusion
- Simulation based on the queuing theory can optimize actual production situation
- Allows to find bottlenecks in the production chain
- Can optimally scheduled server maintains
- Increase productivity (reduce CO2 emission)
- Can show what happened if server is breakdown, the queue is limited, new server is add or removed in the line, …
- Simulation can train the machine operators how to react on nonstandard or breakdown situation
- Can help with new production line proposal
- Industry 4.0
Reference
2016 - BOSCH Jihlava
Contact
- Brno University of Technology,
- Faculty of Mechanical Engineering, Energy Institute
- Technicka 2, Brno 616 69 Brno, Czech Republic
- Tel: +420 541 143 269
- Email: mauder@fme
 vutbrcz, stetina@fmevutbrcz